Typically we start with raw (untidy) data. So we need to clean and organize the data. To do this we need to understand:
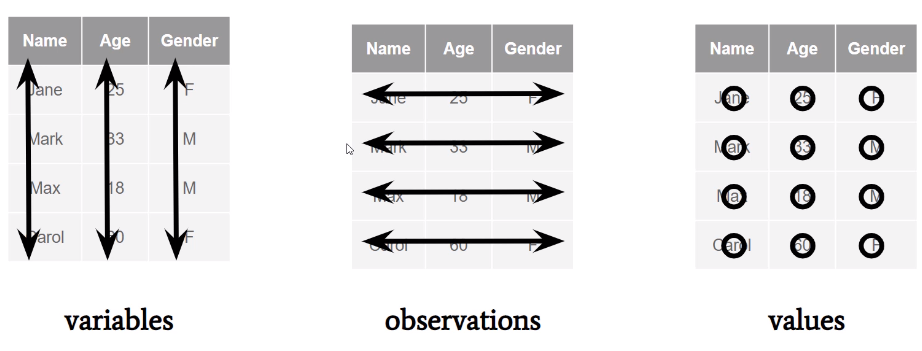
each variable is a single column
each observation is a single row
each value is a single cell
Figur2 2: Data structure.
In this supporting material, we will use the mpg dataset, available in the tidyverse package collection, which deals with the fuel economy of popular cars from 1999 to 2008, containing 234 observations and 11 variables.